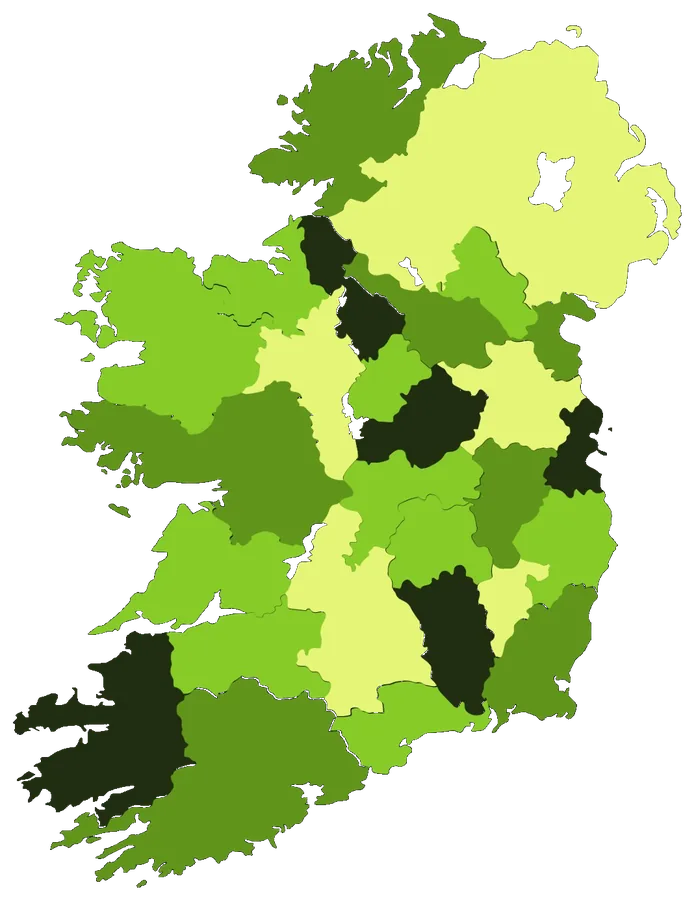
All 32 counties
Solar in every county
How much electricity a roof can make depends on where it is. Here is each county ranked by solar yield, with a local guide to grants, the grid connection and export payments.
Range across the 32 counties
834 to 1088
kWh per kWp per year
Wexford
Highest yield
914
Median county
Source: PVGIS, European Commission JRC. Fetched 2026-11-13.
Ranking
Counties ranked by solar yield
Annual output of 1 kWp of panels facing due south at a 35 degree tilt, with 14% system losses, at each county town. Counties in Northern Ireland are marked NI. A real roof will differ; a site survey confirms it.
| Rank | County | kWh / kWp | Relative yield |
|---|---|---|---|
| 1 | Wexford Wexford | 1088 | |
| 2 | Waterford Waterford | 1034 | |
| 3 | Cork Cork | 1007 | |
| 4 | Wicklow Wicklow | 996 | |
| 5 | DownNI Downpatrick | 986 | |
| 6 | Dublin Dublin | 973 | |
| 7 | Kilkenny Kilkenny | 945 | |
| 8 | Carlow Carlow | 942 | |
| 9 | Louth Dundalk | 937 | |
| 10 | Meath Navan | 937 | |
| 11 | Clare Ennis | 932 | |
| 12 | Laois Portlaoise | 932 | |
| 13 | Offaly Tullamore | 931 | |
| 14 | Westmeath Mullingar | 927 | |
| 15 | Roscommon Roscommon | 924 | |
| 16 | Limerick Limerick | 918 | |
| 17 | Longford Longford | 909 | |
| 18 | Galway Galway | 908 | |
| 19 | Kildare Naas | 906 | |
| 20 | Kerry Tralee | 902 | |
| 21 | Leitrim Carrick-on-Shannon | 892 | |
| 22 | Cavan Cavan | 891 | |
| 23 | AntrimNI Antrim | 891 | |
| 24 | Monaghan Monaghan | 887 | |
| 25 | ArmaghNI Armagh | 886 | |
| 26 | Mayo Castlebar | 885 | |
| 27 | Tipperary Clonmel | 871 | |
| 28 | TyroneNI Omagh | 859 | |
| 29 | FermanaghNI Enniskillen | 850 | |
| 30 | Donegal Letterkenny | 845 | |
| 31 | Sligo Sligo | 845 | |
| 32 | Derry/LondonderryNI Derry | 834 |
Thinking about solar in your county?
Get a free estimate from a registered installer near you. Start with your electricity bill; it shows how much of your use falls in daylight.